A Power BI report should do more than display numbers. It should help users understand what is happening, investigate changes, and find answers without digging through multiple pages. That is where interactivity becomes important.
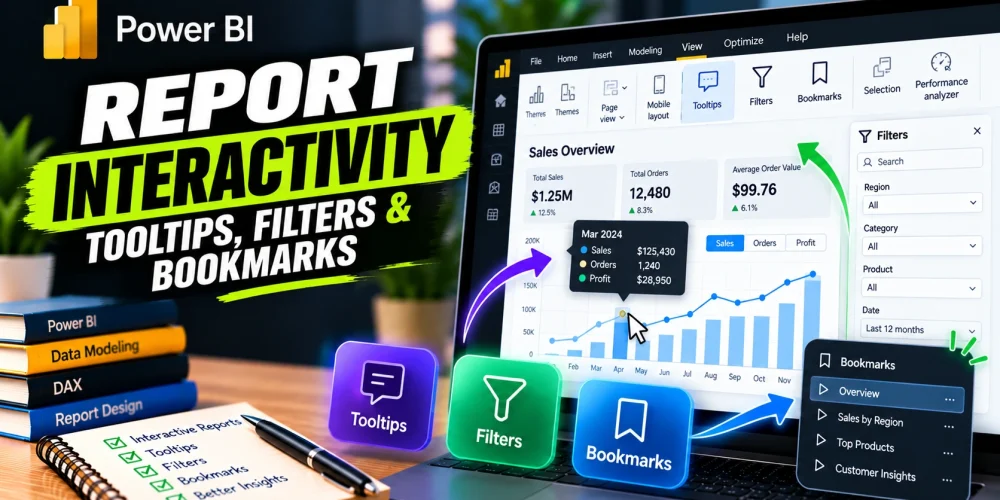
Power BI offers several ways to make this possible. Tooltips reveal additional details, filters narrow down the data, bookmarks switch between saved views, and buttons make navigation easier. Used together, these features can turn a basic dashboard into a practical tool for business analysis.
How to Add Tooltip in Power BI
Imagine a sales dashboard showing monthly revenue. A manager notices that sales increased in March and wants to know which products contributed to the growth. Adding more charts to the page might make the report crowded, but hiding all the details would make the analysis difficult.
Tooltips offer a middle ground. They display additional information when users hover over a data point, keeping the main report clean while making more details available when needed.
Power BI supports two main approaches: default tooltips and report page tooltips.
Using Default Tooltips
Default tooltips display information associated with a visual. You can add relevant fields to provide more context than the chart shows on its own.
To set one up:
- Select the chart or visual in Power BI Desktop.
- Find the Tooltips field well in the Build visual pane.
- Drag the additional fields you want to display into that section.
- Hover over the visual’s data points to check the result.
For example, a column chart showing revenue by product could display profit margin and order quantity in its tooltip. A manager can now investigate product performance without switching to another chart.
Creating a Report Page Tooltip
When default tooltips are not enough, you can create a separate report page containing charts, cards, and other visuals. This gives you greater control over the information users see.
Follow these steps:
- Create a new page in Power BI Desktop.
- Select the page and open its formatting settings.
- Set the page type to Tooltip under Canvas settings, where available.
- Enable Allow use as tooltip in the page information settings.
- Add the visuals you want to display, such as a profit card or a small sales trend chart.
- Return to the main report and select the visual that will trigger the tooltip.
- In its tooltip settings, choose the report page you created.
Now, hovering over a product category can display a compact view of its revenue, profit, and sales trend. The tooltip uses the data context of the selected point, so its visuals can reflect the relevant category.
How to Filter in Power BI
Tooltips help users investigate individual values, but sometimes they need to examine a smaller part of the dataset. For example, a regional manager may want to review sales in Dhaka during the last quarter instead of looking at company-wide performance.
Power BI filters make this possible. They control which records contribute to the results displayed in a visual, on a page, or throughout a report.
Understanding Power BI Filter Types
Power BI provides several filtering options, and knowing where each one applies helps you build reports that behave as expected.
| Filter type | What it does | Example |
| Visual-level | Filters one visual | Show the top 10 products by revenue |
| Page-level | Filters visuals on one page | Display data for the current financial year |
| Report-level | Applies across report pages | Exclude cancelled orders throughout the report |
| Slicer | Lets users select values directly on the page | Choose a region or reporting period |
To apply a filter, select the relevant visual, page, or report and open the Filters pane. Add a field to the appropriate filter section, choose the required values or conditions, and check the resulting data.
The distinction matters. A visual-level filter is useful when one chart needs a different selection from the rest of the page. A report-level filter is more appropriate when the same restriction should apply throughout the report.
Adding a Slicer for Interactive Filtering
Filters in the Filters pane are useful for controlling report logic, but slicers give users a visible way to explore the data themselves.
To add a slicer:
- Select a blank area of the report canvas.
- Insert a Slicer visual.
- Drag a field such as Region, Product Category, or Order Date into it.
- Choose a suitable layout and format the slicer.
- Select different values to test how the other visuals respond.
Suppose you are building a sales dashboard for senior management. A Region slicer allows users to compare performance across different locations without requiring separate dashboards for each region.
You can also control which visuals respond to a slicer through Format > Edit interactions. This is helpful when you want a particular chart to remain unchanged while the rest of the page updates.
One practical consideration is the number of slicers you add. Too many controls can distract users from the analysis. Start with the dimensions they are most likely to investigate, such as date, region, and product category.
Read More: What is a paginated report in power bi
How to Use Bookmarks in Power BI
Filters let users explore data dynamically. Bookmarks serve a different purpose: they save a particular report view so users can return to it or switch between predefined views.
Consider a dashboard that contains revenue, profit, and sales volume. Some users may want to focus on revenue performance, while others need to examine profitability. Instead of building separate pages for every perspective, you can use bookmarks to show different combinations of visuals on the same page.
Creating a Bookmark
First, arrange the report page exactly as you want users to see it. Set the required filters, slicers, and visual visibility before saving the view.
Then follow these steps:
- Open the View tab in Power BI Desktop.
- Enable the Bookmarks pane.
- Configure the report page for the view you want to save.
- Select Add in the Bookmarks pane.
- Rename the bookmark to something meaningful, such as Revenue Overview.
- Repeat the process for other views.
You can update a bookmark later if the report layout or saved state changes.
Understanding Bookmark Settings
Bookmarks can preserve different aspects of a report, so it is worth checking their settings before using them for navigation.
- Data: Captures applicable data states, including filter and slicer selections.
- Display: Captures display properties, such as whether visuals are visible.
- Current page: Determines whether the bookmark stores the current report page.
- Selected visuals: Restricts the bookmark’s effect to selected visuals rather than the entire page, depending on the configuration.
For example, you could create a Revenue Overview bookmark that shows revenue-related visuals and another called Profitability Analysis that displays profit-related charts. Both views can occupy the same report page.
There is one detail to watch. If a bookmark is intended only to show or hide visuals, its Data setting may need to be disabled. Otherwise, activating it could restore previously saved slicer selections and change the user’s current analysis.
Bookmark names should describe the view or question they represent. Clear labels make it easier for users to understand what they will see before selecting one.
How to Add Buttons in Power BI
Bookmarks are useful, but users need a convenient way to activate them. Buttons provide that connection. They can also navigate between report pages or perform other supported actions.
For example, a sales dashboard might include a button labeled View Profitability that switches to a saved view of profit-related charts. Another button could take users to a detailed sales page.
Adding and Configuring Buttons
To create a button in Power BI Desktop:
- Open the Insert tab and select Buttons.
- Choose a button style, such as a blank button or back button.
- Place it on the report canvas.
- Select the button and open its formatting settings.
- Enable Action.
- Choose an action type, such as Bookmark or Page navigation.
- Select the bookmark or report page that the button should open.
- Adjust the button’s text, appearance, and placement.
If you want a button to activate a bookmark, create and test the bookmark first. Then assign it to the button through the Action settings.
You can also use Power BI’s bookmark and page navigators to create navigation controls automatically. These can be easier to maintain when a report contains several pages or saved views.
Remember: In Power BI Desktop’s editing mode, you generally need to hold Ctrl while clicking a button to activate it. In the Power BI Service, published report interactions work differently from editing mode.
Bringing Everything Together in a Real Report
The real value of these features becomes clearer when they work together. Imagine a sales performance dashboard used by regional managers. The main page shows revenue, profit margin, and monthly sales trends. A Region slicer allows users to focus on a specific location, while a report page tooltip reveals product-level details when they hover over a chart.
Two bookmarks provide different perspectives: Revenue Performance and Profitability Analysis. Buttons let users switch between these views or navigate to a page containing detailed transactions.
The workflow is straightforward:
- Select a region using the slicer.
- Hover over a chart to investigate an unexpected result.
- Switch to another analytical view using a bookmark.
- Open the detailed report page if more investigation is needed.
Each interaction has a clear purpose. Filters narrow the scope, tooltips provide context, bookmarks offer alternative views, and buttons connect the different parts of the report.
Common Issues to Check Before Publishing
Before sharing a report, test how its interactive features behave together. A tooltip might display unexpected values because of the data context, while a bookmark might restore an older filter selection. A button can also appear correct but lead to the wrong page if its action is misconfigured.
Check the following:
- Tooltips: Confirm that the displayed values match the selected data point.
- Filters: Check that slicers affect the intended visuals and do not exclude relevant records.
- Bookmarks: Verify whether each bookmark should preserve or ignore the current slicer selections.
- Buttons: Test every action and confirm that it opens the correct view.
- Layout: Make sure interactive controls do not compete with the main charts for attention.
It is also worth testing the report with realistic user scenarios. Select different regions, change dates, activate bookmarks, and navigate between pages. The report should remain understandable as users move from one view to another.
Start with the questions your audience needs to answer, then choose the interactions that help them get there. A report built around that principle will be easier to explore, easier to maintain, and more useful for everyday business decisions.