
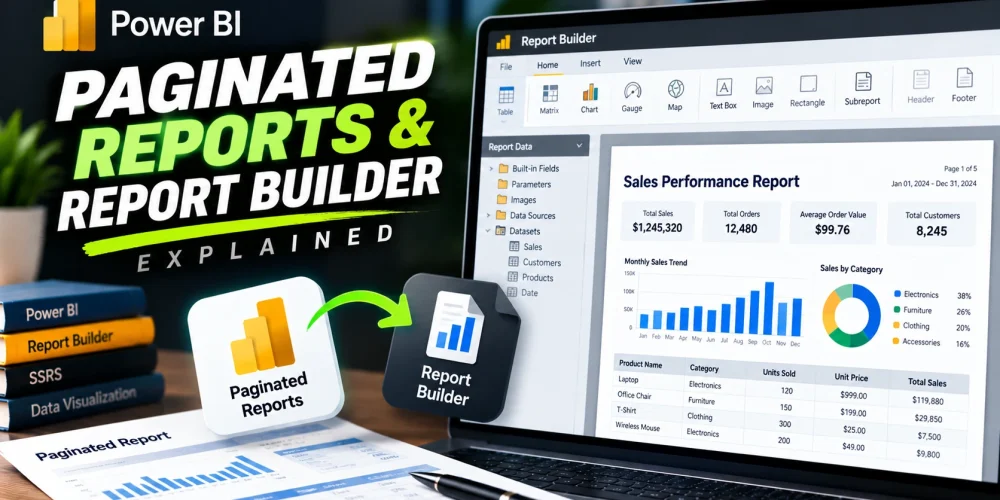
A Power BI dashboard can tell you how a business is performing, but sometimes you need more than charts, cards, and interactive visuals. You may need a detailed sales report with every transaction, an invoice that follows a fixed layout, or a financial statement that prints neatly across several pages. In these situations, a regular Power BI report may not be the most practical choice.
This is where paginated reports come in. They are designed for structured, detailed reporting, especially when the layout, page breaks, and printed output matter as much as the data itself. Microsoft Power BI supports this reporting format through Power BI Report Builder, a separate tool that lets you design reports with precise control over how information appears on each page.
What Is a Paginated Report in Power BI?
A paginated report in Power BI is a formatted report designed to display data across as many pages as necessary. Unlike a typical interactive Power BI report, which focuses on visual exploration, a paginated report prioritizes structured information, precise layouts, and consistent output for printing or exporting.
The term paginated refers to how the report content flows across individual pages. If a table contains hundreds or thousands of records, the report can continue onto additional pages while maintaining its formatting, column alignment, headers, and other layout elements. You do not need to squeeze everything into a single screen or scroll through a dashboard to find the information you need.
For example, imagine a retail business that needs a monthly sales report containing product names, quantities sold, transaction dates, customer details, taxes, and total revenue. A dashboard might summarize the month’s performance with charts and KPIs, but the finance department may need every transaction in a structured document. A paginated report can present those records in a consistent, print-ready format.
Power BI paginated reports are particularly useful when organizations need documents that follow a specific reporting standard. They can support detailed tables, grouped data, subtotals, page numbering, repeating headers, and parameter-driven filtering. Depending on the report design and supported data source, users can also generate output in formats such as PDF, Excel, Word, and other supported formats.
Read More: How to export power bi to excel
Power BI Paginated Reports vs. Regular Power BI Reports
Both report types help people understand business data, but they serve different purposes. Choosing between them depends on how users need to interact with the information and what they expect to do with the final report.
A standard Power BI report is built around interactive data exploration. Users can select visuals, apply slicers, drill into categories, and examine trends across different dimensions. Paginated reports focus more on presenting detailed information in a controlled layout that remains consistent when viewed, printed, or exported.
Consider a sales manager reviewing monthly revenue. A standard Power BI report can show which regions performed best, how sales changed over time, and which products contributed the most revenue. A paginated report can provide a detailed transaction listing that supports the same business review but serves a different operational purpose.
Here are the main differences:
| Feature | Regular Power BI Report | Paginated Report |
| Primary purpose | Interactive data analysis | Detailed, formatted reporting |
| Layout | Canvas-based and visual | Page-based with precise layout control |
| Data presentation | Charts, cards, tables, and other visuals | Detailed tables, lists, matrices, and text |
| Page handling | Designed mainly for on-screen exploration | Designed to flow across multiple pages |
| Printing | Possible, but layout may require adjustments | Better suited to controlled, print-ready output |
| Exporting | Supports several export options, depending on the report and service | Strong support for structured, multi-page document output |
| Best suited for | Dashboards, trends, and exploratory analysis | Invoices, statements, operational reports, and detailed listings |
What Is Power BI Report Builder?
Power BI Report Builder is Microsoft’s desktop application for creating paginated reports. It provides a report-design environment where you can define data sources, write queries, arrange report elements, configure parameters, and control how the final document is formatted.
Unlike the usual Power BI Desktop workflow, Report Builder is built specifically for page-oriented reporting. You can place tables and text at precise positions, group records by categories, add calculated expressions, and define how content should appear when the report is rendered into a document.
For example, suppose a company sends monthly account statements to hundreds of customers. Each statement needs a company logo, customer details, a transaction table, outstanding balances, and a closing summary. With Report Builder, you can create a reusable template and use parameters or query logic to generate the appropriate statement for each customer.
The tool also supports report parameters, which allow users to filter report data before viewing or generating the output. You might create parameters for a reporting period, department, customer ID, or sales region. This makes a single report useful for different business requirements without requiring a separate report for every situation.
One important distinction is that Power BI Report Builder and Power BI Desktop are separate applications with different purposes. You do not need to create a regular Power BI report first to build a paginated report. You can design a paginated report independently, connect it to a supported data source, and publish it to a compatible Power BI workspace when the required permissions and licensing are available.
How Do Power BI Paginated Reports Work?
A paginated report follows a structured process: connect to data, define how the data should be retrieved, design the layout, and render the report in the required format. Understanding these steps makes it easier to see how Report Builder fits into a larger reporting workflow.
1. Connect to a Data Source
The first step is to choose where the report will retrieve its data. Depending on the environment and supported connection methods, Report Builder can work with sources such as SQL Server, Azure SQL Database, Power BI semantic models, and other supported data providers.
For example, a finance department might retrieve invoice records from a SQL database, while an analyst may use an existing Power BI semantic model that already contains business calculations and relationships. The appropriate source depends on where the required data lives and how the organization manages access.
2. Define the Dataset
After establishing a connection, you define the dataset that supplies the report’s information. This may involve writing a SQL query, selecting fields, configuring a supported query, or retrieving data through another compatible method.
A sales report might need transaction date, customer name, product, quantity, unit price, and total amount. By selecting the relevant fields and applying appropriate filters, you can prepare the information before placing it into the report layout.
3. Design the Report Layout
This is where Report Builder becomes particularly useful. You can arrange tables, matrices, text boxes, images, page headers, footers, and other report elements according to the required document structure.
You can also configure grouping, sorting, subtotals, conditional formatting, and expressions. For example, a sales report might group transactions by region, show a subtotal for each region, and display a grand total at the end. Page settings and repeating headers help keep the document readable as the content continues across multiple pages.
4. Add Parameters and Filters
Parameters let users control which information appears in the report. Instead of building separate reports for different months or departments, you can create one report that accepts the required values.
For example, a report might include a start date, end date, and region parameter. When a user selects a reporting period and region, the report returns the relevant records according to its query and parameter configuration. This is useful for recurring reports that follow the same structure but contain different data each time.
5. Preview, Export, and Publish
Once the report is designed, you can preview it to check the data, layout, pagination, and formatting. This step is important because a report that looks correct in the design environment may need adjustments to fit neatly on printed pages.
After testing, you can publish the report to a supported Power BI workspace, subject to the applicable licensing and permissions. Users can then view it through a compatible Power BI experience and export it to supported formats. The available publishing, viewing, and export options depend on the environment, report configuration, and user access.
When to Use Paginated Reports
Paginated reports are most useful when the output needs to follow a defined structure rather than simply display information interactively. The following situations are good examples of where they can add value.
Financial Statements and Invoice Generation
Financial documents often require consistent formatting, clearly defined sections, and accurate presentation of individual records. An invoice, account statement, or payment summary may need customer information at the top, itemized transactions in the middle, and taxes or outstanding balances at the bottom.
Paginated reports can help automate these documents while keeping their layout consistent. Instead of manually formatting every statement in a spreadsheet or word processor, a business can create a reusable report template that draws information from its data source.
Detailed Operational Reports
Some teams need to review every record rather than just a summary of performance. Procurement departments may need a complete list of purchase orders, HR teams may need employee listings, and logistics teams may require shipment details for a particular period.
A regular Power BI report can display tables, but a paginated report is often a better fit when the complete listing must be organized into a predictable, multi-page document. Grouping, sorting, repeated column headers, and page numbering make lengthy reports easier to navigate.
Reports That Need to Be Printed
Printing requirements are another strong reason to use paginated reports. Business users may need physical copies of compliance documents, stock reports, sales registers, or monthly operational summaries.
Paginated layouts provide greater control over page dimensions, margins, headers, footers, and page breaks. This makes them useful when a report must follow a specific document format instead of adapting to the available screen space.
Recurring Reports for Different Departments or Customers
Many organizations produce similar reports every week or month, with only the selected period, department, or customer changing. Building each report manually wastes time and increases the chance of formatting errors.
With parameters and reusable layouts, a paginated report can serve multiple reporting needs. A sales report, for example, can use the same design to generate separate results for different regions or reporting periods. This reduces duplication and helps standardize how information is presented across the business.
Reports That Need Structured Exports
Some users need a document they can distribute, archive, or review outside Power BI. A finance team might need a PDF for recordkeeping, while another department may prefer Excel for further analysis.
Paginated reports are designed to support structured document output. They can be especially helpful when exporting long tables or multi-page reports where maintaining the intended layout matters. However, export behavior varies by format, and users should test the final output to confirm that it meets their requirements.
When Should You Use a Regular Power BI Report Instead?
Paginated reports are not the best solution for every reporting task. If the main goal is to explore data, discover trends, and interact with visual summaries, a standard Power BI report will usually be the more practical option.
For example, a marketing manager tracking campaign performance may want to compare conversions across channels, filter results by date, and drill into individual campaigns. Interactive charts and slicers make this kind of analysis easier than a fixed, page-oriented document.
Similarly, an executive dashboard designed for quick performance monitoring does not usually need the detailed pagination features offered by Report Builder. A few well-designed visuals may communicate the main business insights more effectively than a long report containing every record.
Use the distinction as a practical guide: choose regular Power BI reports for exploration and paginated reports for structured documentation. If your audience needs both, you can provide an interactive report for analysis and a paginated version for detailed records or printing.
How to Create a Paginated Report Using Power BI Report Builder
Creating your first paginated report is easier when you start with a clear reporting requirement. You do not need to build an elaborate financial statement immediately. A simple table containing sales transactions is enough to learn the essential workflow.
Step 1: Install Power BI Report Builder. Download the application from Microsoft’s official Power BI resources and install it on your computer. Check the current system requirements and supported connection options before beginning.
Step 2: Create a new report. Open Report Builder and start a new report. Depending on your requirements, you can begin with a blank report or use a report wizard to guide the initial setup.
Step 3: Configure the data source. Connect the report to the database, semantic model, or other supported source that contains your information. Make sure your account has the necessary permissions to access the data.
Step 4: Create a dataset. Select the fields you need and configure the query. For a basic sales report, you might include order date, customer name, product, quantity, and total sales.
Step 5: Add a table or matrix. Insert a table to display the selected fields. If you need to organize the data by department, region, or product category, configure the relevant groups and subtotals.
Step 6: Format the report. Add a title, column headings, page numbers, and any necessary branding. Set the page size and margins, and configure repeating headers if the report spans multiple pages.
Step 7: Preview and test. Check that the data is correct, long values display properly, and the report fits the intended page layout. Test different parameter selections if you have added filters.
Step 8: Publish or export the report. Save the report definition and publish it to a compatible Power BI workspace if your organization has the required access and licensing. You can also use supported export options to generate a document for review.
Following these steps gives you a working foundation. As your requirements become more complex, you can explore expressions, conditional formatting, nested groups, subreports, and more advanced parameter configurations.
What Are the Limitations of Power BI Paginated Reports?
Although paginated reports offer precise formatting and strong support for detailed output, they introduce some trade-offs that are worth understanding before adopting them.
First, the design process can be more technical than creating a basic dashboard. Report Builder uses a different interface and reporting model from Power BI Desktop, so users may need time to learn datasets, expressions, grouping, and page-layout settings. Reports with complicated queries or nested groups can also require careful testing.
Second, paginated reports are not intended to replace interactive visual analysis. They can present structured data effectively, but they are generally less suitable for dashboards where users need to explore relationships between metrics through charts, slicers, and cross-filtering.
Third, publishing and sharing depend on the Power BI environment, licensing, workspace configuration, and user permissions. Creating a report in Report Builder does not automatically mean every user can publish, view, or export it through the Power BI service. Organizations should check the current licensing requirements for their intended deployment.
Finally, report design requires attention to the final output. Long text fields, wide tables, page breaks, and large datasets can affect readability and rendering. A report that works well on screen may need different page settings for PDF or other export formats. Testing the report with realistic data and representative export formats helps prevent these issues.
FAQ
1. What is the difference between Power BI Report Builder and Power BI Desktop?
Power BI Desktop is primarily used to build interactive reports with visuals, filters, and data models. Power BI Report Builder is designed to create paginated reports with precise control over tables, text, grouping, page breaks, and document formatting. The two applications serve different purposes and can complement each other in the same reporting workflow.
2. Are Power BI paginated reports free to create?
Power BI Report Builder is available as a free desktop application, but publishing and sharing paginated reports through the Power BI service may require an eligible license or workspace capacity. The exact requirements depend on how the report is deployed and who needs to access it, so check Microsoft’s current licensing documentation before planning a production setup.
3. Can Power BI paginated reports export to PDF and Excel?
Yes. Paginated reports support export to formats such as PDF and Excel, along with other supported formats. PDF is useful when the report must preserve a document-style layout, while Excel can help users work with the exported data. The exact appearance and behavior may differ between formats, so test the output before distributing it.
4. Can I create paginated reports without Power BI Desktop?
Yes. You can create paginated reports directly in Power BI Report Builder without first building a report in Power BI Desktop. You need an appropriate data source and the required access permissions. You can then design, preview, and save the report, and publish it to a compatible environment when needed.
5. When should I use paginated reports instead of dashboards?
Use paginated reports when you need detailed records, fixed formatting, predictable page breaks, or print-ready documents. Dashboards and interactive reports are generally better for monitoring KPIs, exploring trends, and comparing business performance. If your organization needs both high-level analysis and detailed documentation, using the two formats together can provide a more complete reporting solution.
6. Can paginated reports use Power BI semantic models?
Yes. Power BI semantic models can be used as data sources for paginated reports through supported connections. This can help organizations reuse an existing data model and its defined measures instead of recreating business logic in a separate report. The available connection methods and supported features depend on the environment and configuration.