
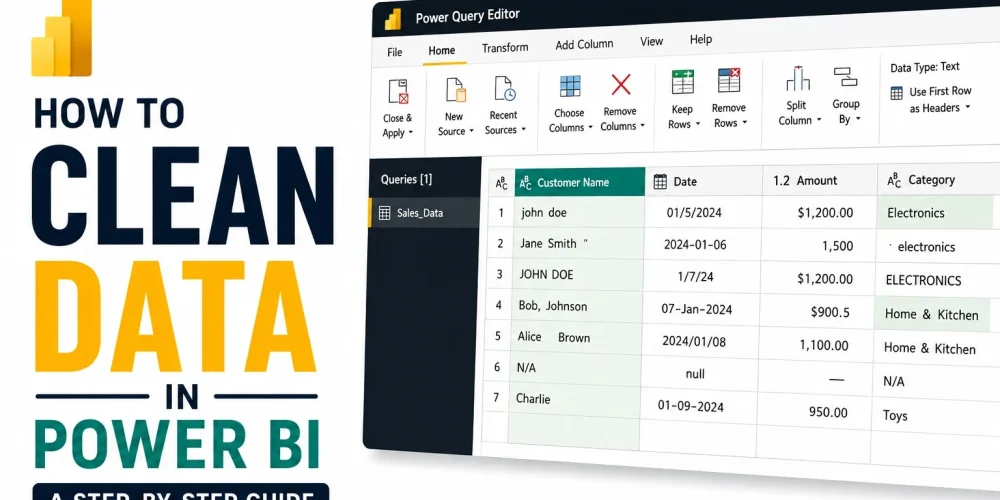
Raw data is rarely ready for analysis. It may contain blank rows, duplicate records, inconsistent formats, unnecessary columns, or incorrect data types. If these issues are not fixed, even a well-designed dashboard can produce misleading results.
This is where data cleaning in Power BI becomes important. Power BI provides a built-in data transformation environment called Power Query Editor, which allows you to clean and prepare data before building reports.
In this guide, we will explain how to clean data to develop Power BI dashboard step by step and explore the most useful techniques for preparing accurate and reliable datasets.
What Is Data Cleaning in Power BI?
Data cleaning is the process of identifying and fixing problems in a dataset before using it for analysis. The goal is to make the data accurate, consistent, and easier to work with.
In Power BI, most data cleaning tasks are performed inside Power Query Editor. You can remove duplicates, replace missing values, change data types, split columns, standardize text, and perform many other transformations without changing the original data source.
Power Query also records each transformation as an Applied Step. When the dataset is refreshed, Power BI automatically applies those steps again. This makes the cleaning process repeatable and reduces the need for manual work.
10 Steps of Power BI Data Cleaning Best Practices
After connecting your data source to Power BI Desktop, you can open Power Query Editor by selecting Transform Data from the Home tab.
The Power Query Editor window gives you access to your queries, data preview, transformation tools, and applied steps. Before making changes, take some time to inspect the dataset. Look for missing values, inconsistent column names, incorrect data types, duplicate records, and columns that are not useful for your analysis.
Once you understand the condition of the data, you can begin cleaning it systematically.
1. Remove Unnecessary Columns and Rows
A dataset often contains information that is not required for the final report. Keeping unnecessary columns increases clutter and can make the data model larger than needed.
In Power Query Editor, select the columns you do not need and choose Remove Columns. You can also remove blank rows, top rows, bottom rows, or rows that contain errors.
The goal is not to remove data randomly. Keep only the information that supports your analysis and reporting requirements.
For example, if you are analyzing sales performance, internal notes or unused system-generated fields may not be necessary in the final model.
2. Fix Incorrect Data Types
Setting the correct data type is one of the most important steps when learning how to clean data in Power BI.
Power BI needs to understand what each column represents. A sales amount should normally be stored as a decimal number or currency, while an order date should use a date format. If a numeric column is stored as text, calculations may not work correctly.
Common data types include:
- Text
- Whole number
- Decimal number
- Date
- Date and time
- True/False
Check the data type icon beside each column name and correct any mismatches before moving forward.
3. Remove Duplicate Records
Duplicate data can distort totals, averages, customer counts, and other calculations. For example, if the same transaction appears twice, your sales report may show higher revenue than the business actually generated.
To remove duplicates, select the column or combination of columns that should contain unique values. Then go to Remove Rows and select Remove Duplicates.
However, duplicates should be investigated before removal. Two rows that look similar may represent separate transactions. Understanding the business context helps you decide which records are truly duplicates.
4. Handle Missing and Null Values
Missing values are common in real-world datasets. In Power Query, missing data often appears as null.
The correct way to handle null values depends on what the column represents. You may remove rows with missing critical information, replace null values with a default value, or leave them unchanged if the missing information is meaningful.
For example, a missing discount value may logically mean that no discount was applied. In that case, replacing null with 0 could make sense. A missing customer ID, however, may require further investigation.
Avoid replacing every null value automatically. The decision should be based on the meaning of the data.
5. Clean and Standardize Text Data
Text inconsistencies can create major problems during analysis. Values such as “Dhaka,” “dhaka,” and “DHAKA” may represent the same location but appear as separate categories in a report.
Power Query provides several useful text transformation options. You can:
- Convert text to uppercase or lowercase
- Capitalize each word
- Remove extra spaces using Trim
- Remove unwanted characters using Clean
- Replace inconsistent values
6. Rename Columns Clearly
Column names should be easy to understand. Names such as Cust_ID, Trans_Amt, or Column1 may make sense to the original system but can make report development more confusing.
Rename columns using clear and consistent terms such as:
- Customer ID
- Transaction Amount
- Order Date
- Product Category
Clear column names improve the readability of the data model and make it easier to write DAX measures later.
7. Split or Merge Columns
Sometimes a single column contains multiple pieces of information. For example, a full name column may contain both first and last names, or a product code may include several values separated by a delimiter.
The Split Column feature allows you to divide a column based on a delimiter, number of characters, or position.
You can also merge multiple columns when the analysis requires a combined value. For example, first name and last name columns can be merged into a full name column.
8. Replace Incorrect or Inconsistent Values
Datasets often contain spelling variations, outdated labels, or inconsistent category names.
For example:
- “USA” and “United States”
- “M” and “Male”
- “Completed” and “Complete”
If these values represent the same category, they should be standardized. Use the Replace Values option in Power Query to create a consistent naming structure.
9. Identify and Fix Errors
Errors may appear after changing data types or performing transformations. For example, converting a text value into a number can create an error if some rows contain non-numeric characters.
Power Query allows you to identify these errors and decide how to handle them. You can replace the error, remove the affected rows, or return to an earlier transformation step and fix the underlying issue.
Removing errors without understanding their cause can hide data quality problems. It is usually better to investigate why the error occurred first.
10. Review Applied Steps Before Loading the Data
Every transformation performed in Power Query appears in the Applied Steps section. This creates a clear sequence of how the raw data was transformed.
Review these steps before loading the data into Power BI. Make sure that each transformation is necessary and that no important records were accidentally removed.
Once the dataset is ready, select Close & Apply. Power BI will apply the transformations and load the cleaned data into the data model.
Best Practices for Cleaning Data in Power BI
A good data cleaning process should be consistent and easy to maintain. Start by understanding the purpose of the dataset before making transformations. Fix structural issues early, set correct data types, and remove unnecessary data before performing more complex transformations.
It is also useful to keep transformation steps logical and organized. Power Query automatically records your work, but a long list of unnecessary steps can make queries harder to understand and maintain.
Most importantly, do not treat data cleaning as a purely technical task. A value that looks incorrect from a technical perspective may have a valid business meaning. Understanding the context behind the data is essential for making the right cleaning decisions.
Why Data Cleaning Matters in Power BI
A dashboard is only as reliable as the data behind it. Poor-quality data can lead to incorrect KPIs, misleading visualizations, and bad business decisions. You can also read how to optimize Power BI for maximum performance for better decision making.
Learning how to clean data in Power BI helps you build a stronger foundation for analysis. Power Query Editor gives you the tools to remove duplicates, handle missing values, correct data types, standardize information, and automate repeatable transformations.
Final Thoughts
Data cleaning is one of the most important stages of any Power BI project. Before creating charts, writing DAX measures, or designing dashboards, the underlying data needs to be accurate and properly structured.
By using Power Query Editor and following a systematic cleaning process, you can transform messy raw data into a dataset that is ready for meaningful analysis. As you work with more datasets, these cleaning techniques will become a natural part of your Power BI workflow.
At Hasan The Analyst, we help businesses turn complex and unstructured data into clear, reliable insights. If your data needs more than basic cleaning, our data analytics and Power BI services can help you build a stronger foundation for reporting and decision-making.